








There are numerous indicators used in forex trading, each with its own characteristics and purposes. Here are five popular forex trading indicators along with a brief description of each:
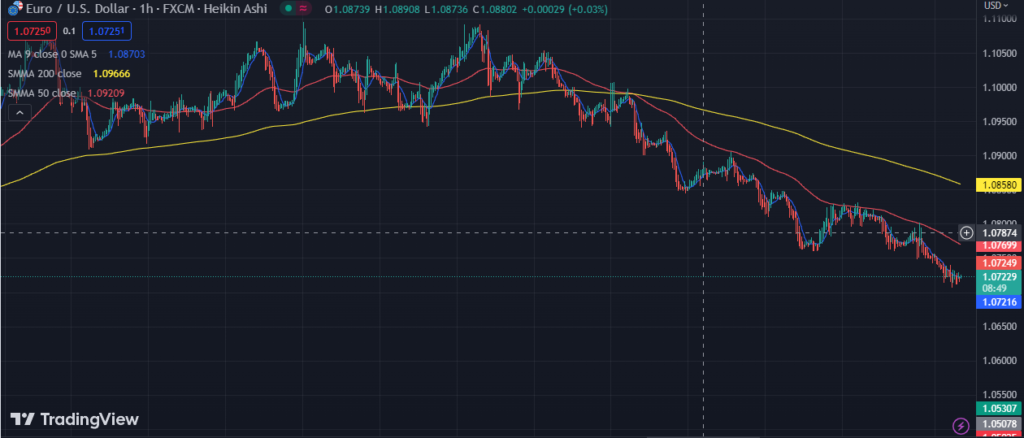
Moving Average (MA)
Moving averages are trend-following indicators that smooth out price data over a specified period. They calculate the average price over a given number of periods and plot a line on the price chart. The two common types of moving averages are the Simple Moving Average (SMA) and the Exponential Moving Average (EMA). MAs help identify trends, support and resistance levels, and potential entry or exit points based on crossovers or bounces off the moving average line.
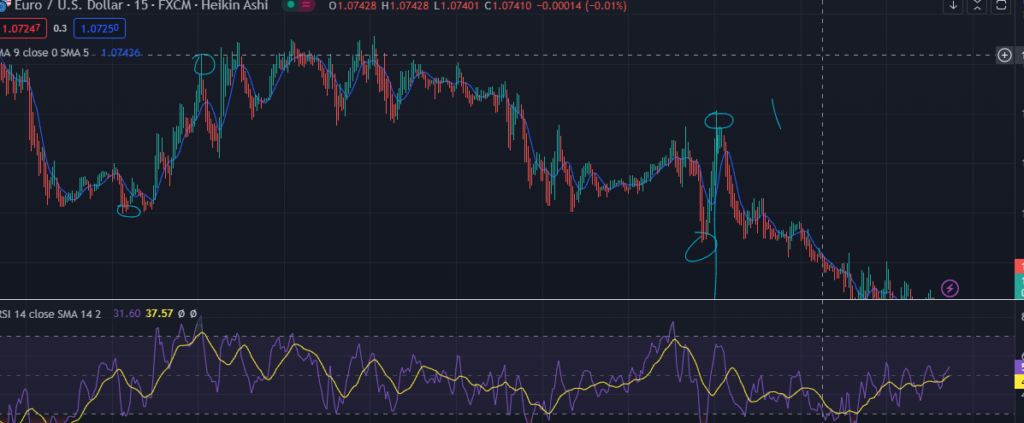
Relative Strength Index (RSI)
The Relative Strength Index is a momentum oscillator that measures the speed and change of price movements. RSI oscillates between 0 and 100 and indicates overbought or oversold conditions. Traders use RSI to identify potential reversals or confirm trend strength. Readings above 70 suggest overbought conditions, while readings below 30 indicate oversold conditions.
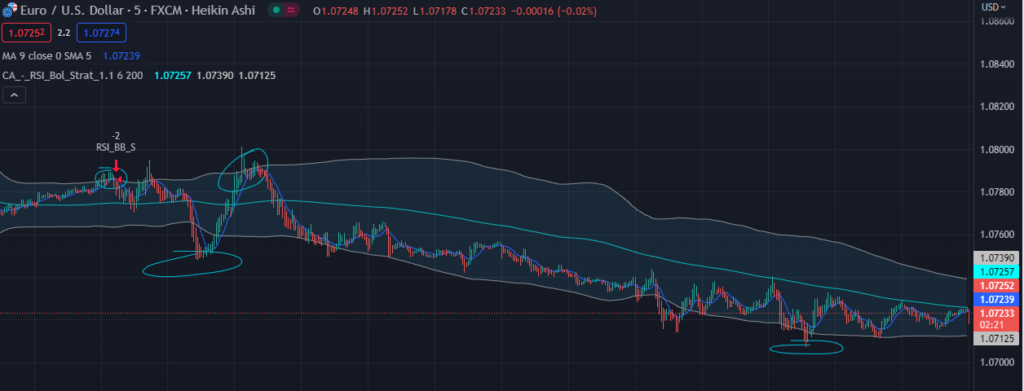
Bollinger Bands Trading Indicators
Bollinger Bands consist of a moving average in the middle and two standard deviation bands plotted above and below the moving average. They help measure volatility and identify potential price reversals. When volatility is high, the bands widen, and when volatility is low, the bands narrow. Traders often look for price bounces or breakouts at the outer bands as potential trade signals.
Fibonacci Retracement
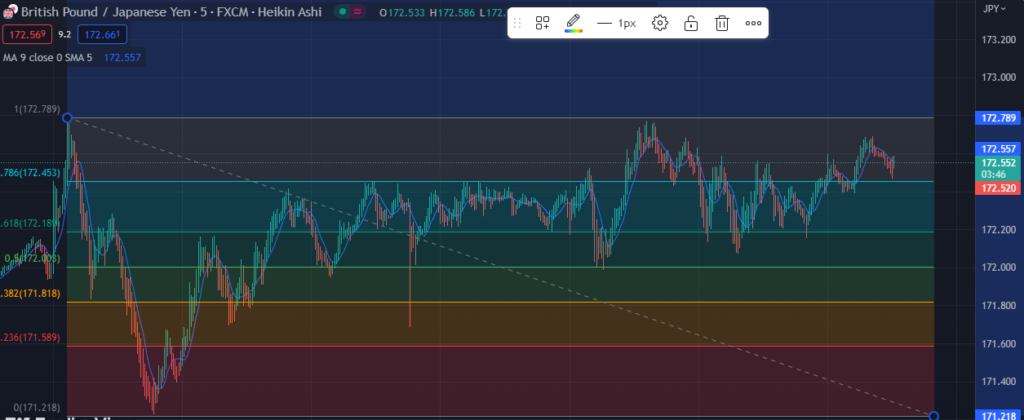
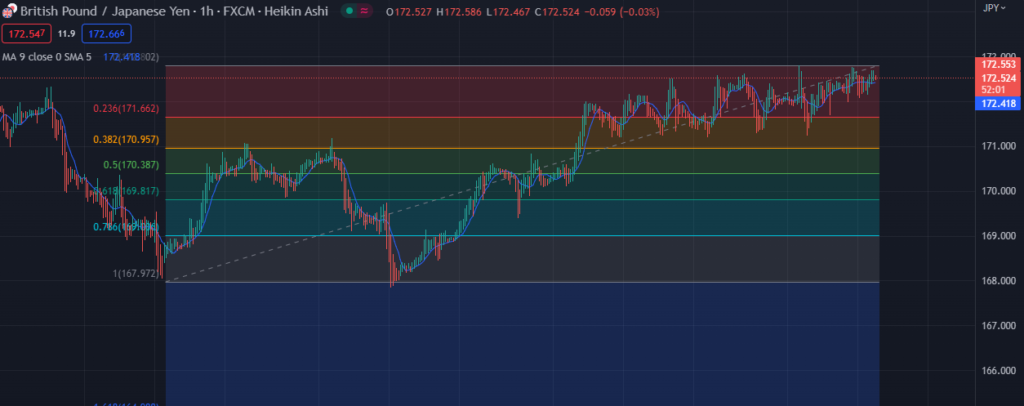
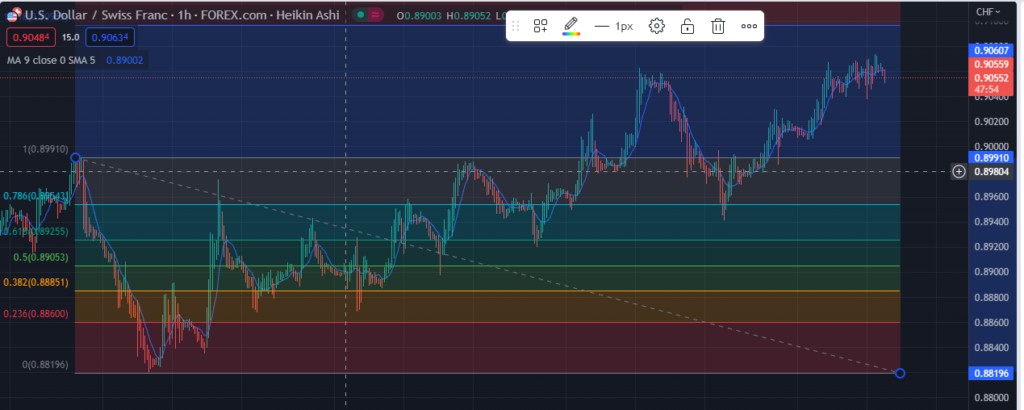
Fibonacci retracement is a technical analysis tool based on the Fibonacci sequence. Traders use this indicator to identify potential support and resistance levels based on the key Fibonacci ratios, namely 23.6%, 38.2%, 50%, 61.8%, and 78.6%. These levels are drawn on the price chart, representing potential areas where price retracements or reversals may occur. Fibonacci retracement can be used in conjunction with other indicators or as standalone levels.
MACD (Moving Average Convergence Divergence)
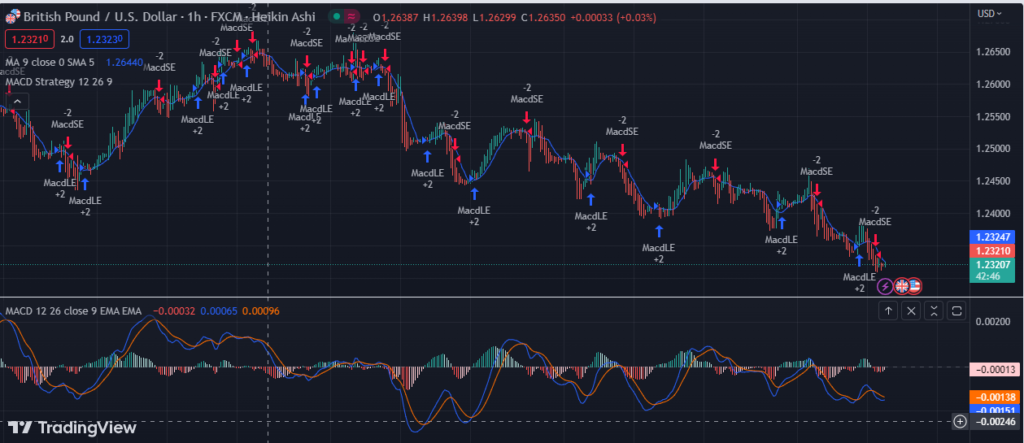
The MACD is a trend-following momentum indicator that consists of two lines: the MACD line and the signal line. The MACD line is calculated by subtracting a longer-term EMA from a shorter-term EMA. The signal line is typically a 9-period EMA of the MACD line. The MACD histogram represents the difference between the MACD line and the signal line. Traders use MACD to identify potential trend reversals, divergences, and crossovers between the MACD line and the signal line.
Get all the trading indicators with the best forex broker right here
It’s important to note that no single indicator guarantees profitable trades. Traders often use a combination of indicators, along with other analysis techniques, to make informed trading decisions. It’s crucial to understand each indicator’s strengths, weaknesses, and their interpretation in the context of market conditions and other supporting factors. Additionally, practice and backtesting are essential for gaining familiarity and confidence in using these indicators effectively.