
 Most Common Mistakes to fix for Financial Success")
 Key Importance and Effects")
 important effects that the Consumer Price Index (CPI) has on our economy.")


10 Psychological Tips and Tricks.")

In forex trading, continuation patterns are chart patterns that suggest the resumption of an existing trend after a period of consolidation or temporary pause. These patterns indicate that the prevailing trend is likely to continue rather than reverse. By recognizing and understanding these patterns, traders can potentially profit from the anticipated continuation of the trend. Here are some common forex continuation patterns and strategies to profit from them:
1. Flag and Pennant Patterns
- Flags and pennants are characterized by a sharp, brief price movement (flagpole) followed by a consolidation period (flag or pennant).
- Enter a long trade when the price breaks above the upper trendline of the flag/pennant pattern with increased volume. Place a stop loss below the pattern’s lower trendline.
- Target profits can be set by measuring the flagpole’s length and projecting it upward from the breakout point.

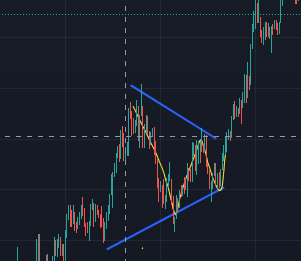
2. Symmetrical Triangle
- A symmetrical triangle is formed when the price consolidates between two converging trendlines.
- Enter a long trade when the price breaks above the upper trendline or below the lower trendline with increasing volume.
- Place a stop loss below the breakout point for long trades or above it for short trades.
- Target profits can be set by measuring the height of the triangle and projecting it upward from the breakout point.


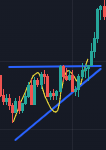
3. Ascending/Descending Triangle
- Ascending triangles have a flat upper trendline and a rising lower trendline, while descending triangles have a flat lower trendline and a declining upper trendline.
- Enter a long trade when the price breaks above the upper trendline of an ascending triangle or below the lower trendline of a descending triangle.
- Place a stop loss below the breakout point for long trades or above it for short trades.
- Target profits can be set by measuring the vertical height of the triangle and projecting it upward for ascending triangles or downward for descending triangles.

4. Bullish/Bearish Rectangle
- A rectangle pattern occurs when the price moves within parallel horizontal trendlines, forming a trading range.
- Enter a long trade when the price breaks above the upper trendline of the rectangle with increased volume.
- Place a stop loss below the breakout point.
- Target profits can be set by measuring the height of the rectangle and projecting it upward from the breakout point.


Remember that no trading strategy guarantees profits, and it’s important to combine these patterns with other technical indicators, risk management techniques, and fundamental analysis. Additionally, it is recommended to practice on a demo account or use small position sizes when implementing new strategies and to stay updated with the latest market developments.